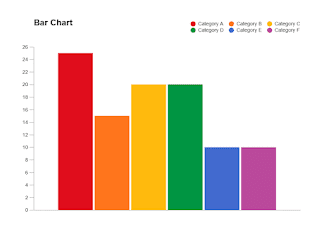
Microsoft Excel allows us to plug in massive amounts of data into a worksheet that is easy to read and understand. Excel also has many tool that allow us to organize and understand the data. Charts built into Excel are one of those tools that can do it for us. There are many charts to choose from, so many that it may be hard to determine which is the correct one to use. Of course, we can edit these charts to best suite our needs by changing the colors and sets of data that are included in them.
One of the many charts types we can use in Excel are Bar Charts. These types of charts are helpful because they allows us to visualize and understand large sets of data easily. These charts are best used when you have data that is independent of each other or when selecting data from certain categories. Line charts are also a type of chart that we can insert into our Excel Worksheets. These charts are best used when we want to measure change over time with data that is separated by even time intervals. Another popular chart type is the Pie chart. These are best used when we want to measure the proportions of each category to the whole. These three chart types are some of the most common ones you will run into but there are plenty to choose from. Just make sure you are using the correct one to represent your data accurately.
You may be wondering how we access all of these amazing charts? Its actually very simple once you know where to navigate to. With Excel running, select the Insert Tab. Right along the middle of ribbon, you will see the option called Charts. From here we can go with the most popular ones or select the more charts option to see additional charts that are available to use. Do not be afraid of trying something new, if you are unsure of what chart to select, hover over the name for a second and a window will pop up with a brief description of the chart.
Good luck and go out there and transform those long data sets into beautiful works of art. 🫡


Alonso, really great blog...I like how you explained when to use what type of chart and inserted the graphics to help.
ReplyDeleteGood job talking about what type of chart and graphics we should use and when. Great blog overall.
ReplyDeleteHi Alonso, for ages, been using charts incorrectly, assuming as long as the data and percentages were there would be enough. Only this class enlightened me about the diverse purposes of charts—pie for proportion, bar for comparison, line for trends. I didn't even know 3D charts were possible! It's great how much we're learning in this class. By the way, I love the cheerful colors of your charts it matches your background.
ReplyDelete